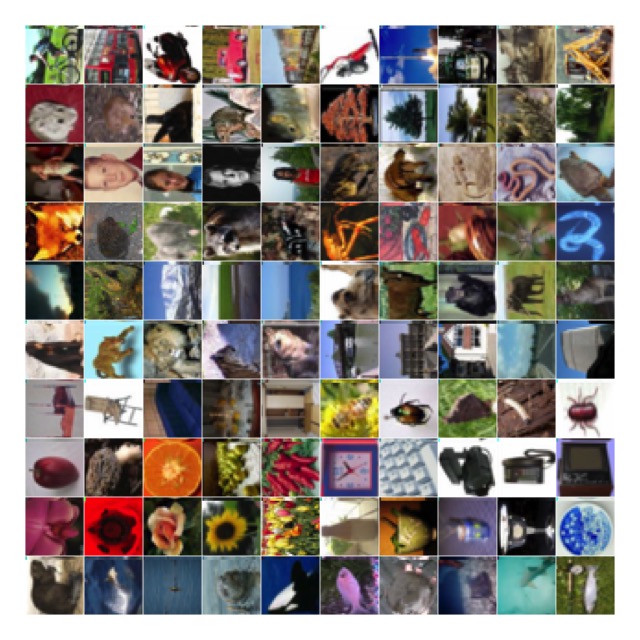
In particular, we read in the binary images using readBin, and used the rasterImage function to create the display.
This dataset is large, consisting of 100 image classes, with 600 images per class.
Each image is 32x32x3 (3 color), and the 600 images are divided into 500 training, and 100 test for each class.
We do not reproduce the dataset here, but point to our source:
https://www.cs.toronto.edu/~kriz/cifar.html on Alex Krizhevsky's homepage at University of Toronto.
We found the the jpeg package useful in R for producing Figure 18.8 (this one is rotated)

In particular, we read in the binary images using readBin, and used the rasterImage function to create the display.